Extracting elevation values for buildings

In this post, a strategy to obtain the elevation of certain locations (i.e. buildings) is proposed.

First, a digital terrain model (DTM) is needed. In the example, the OS Terrain 50 has been used. This is a 50m gridded DTM, with 10m contours and spot heights, which is provided by the Ordnance Survey. In the next figure, the DTM for the Edinburgh area is shown.

dtm_categories

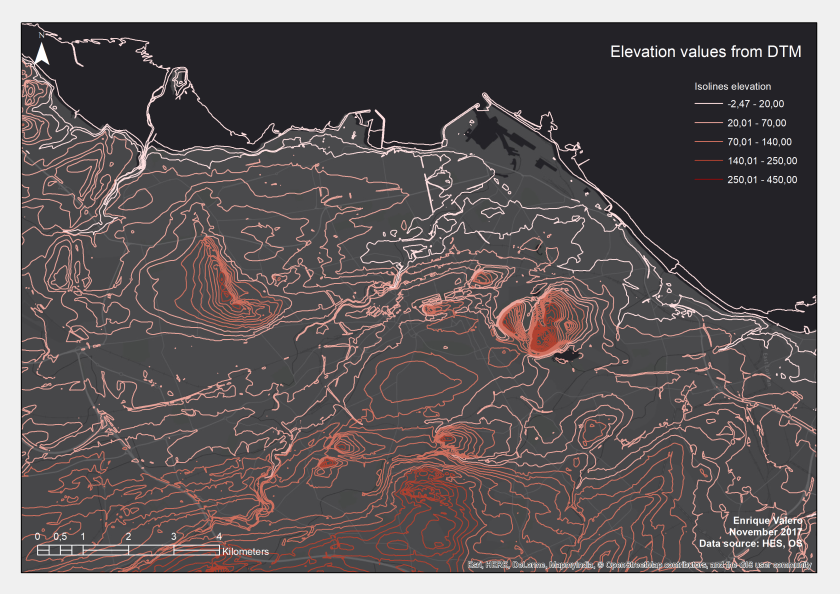
Note that a ‘Merge‘ operation might be needed if the region of interest is covered by several DTMs.

After this operation, a Digital Elevation Model (DEM) is obtained after the DTM. This raster is created by means of the tool ‘Topo to Raster‘. In this example, an output cell size of 50m was used.

dtm_dem

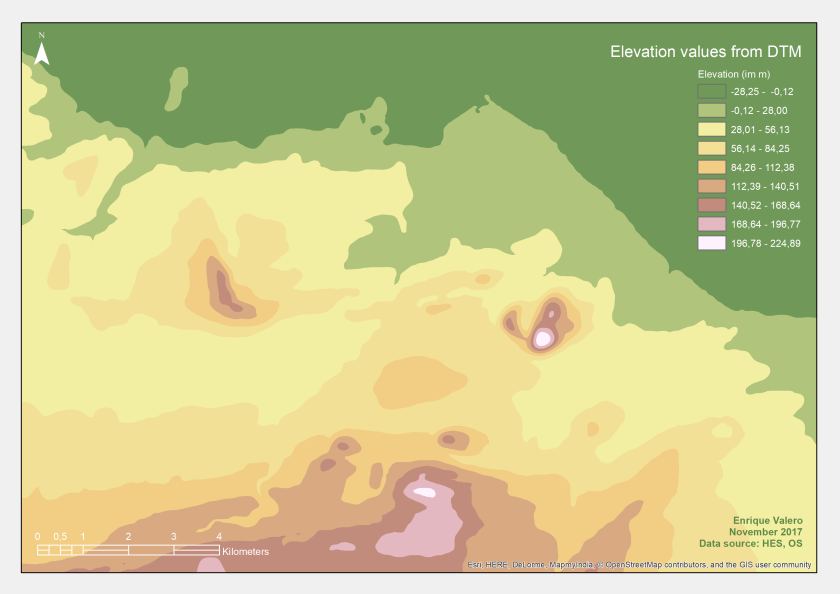
As illustrated in the DEM, the Arthur Seat, in Holyrood Park, is the highest area in Edinburgh. In the West part of the city, Hillwood Park is remarkable, as well as the Pentlands in the South.

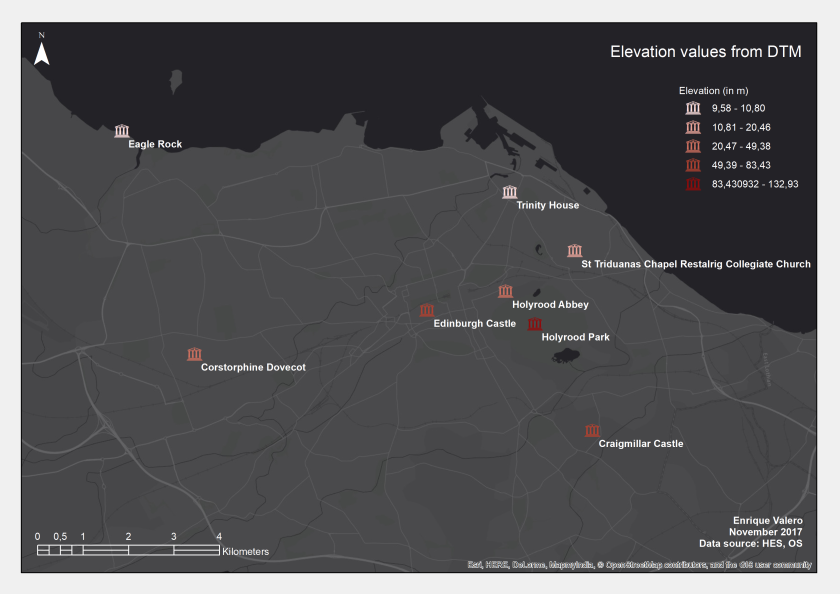
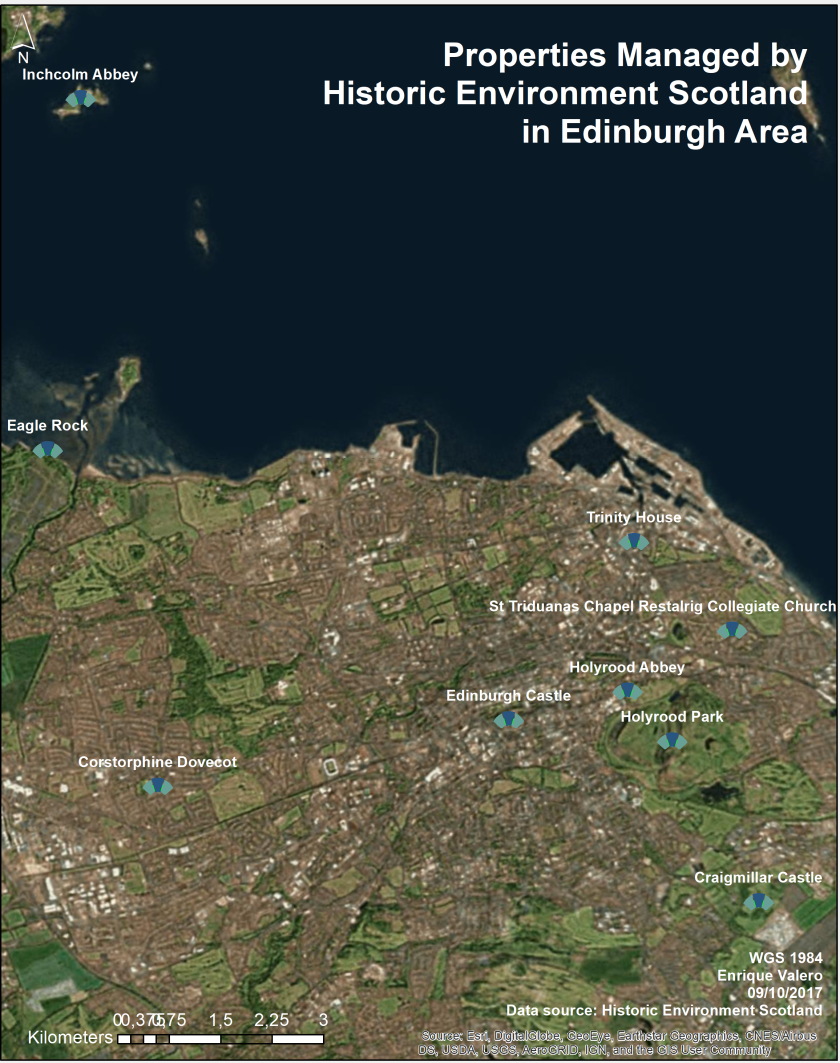
Finally, elevations are extracted from the DEM for all the buildings/regions under study. In this case, the next figure shows the elevation of the properties managed by Historic Environment Scotland (HES) in Edinburgh, which have been extracted by means of ‘Extract multivalues to Points‘.

dtm_to_elevation

Playing with distances between features

As usual in ArcGIS, different tools can deliver similar results. In this post, a map has been generated to show how to [quickly] filter features according to their position with respect to other elements.

There are several proximity tools that can be used to calculate distances between features. Some examples are: Near, Generate Near Table, Buffer or Multiple Ring Buffer.

In the following map, the distances from the attractions managed by Historic Environment Scotland (HES) to the John Muir Way have been calculated by means of Near. After that, the buildings have been filtered by attribute (distance), showing those in a range of [at most] 5 kms along this route.

JM_Way

Personalising symbols for point features in ArcGIS

This is a quick trick to personalise the symbols used to indicate the position of features in our maps in ArcGIS. Even if this is a simple operation, a nice visual effect can be obtained.

You just need to open the Symbol Selector > Edit Symbol.

symbol

In the menu Type, choose Picture Marker Symbol. Browse in your folders and choose the image you want to use as icon. Then, select the size and angle and click OK.

In the following map, I have applied this feature to display the properties managed by Historic Environment Scotland in Edinburgh and surronding area.

HESEdinburgh


Data sources for GIS

In this post, I will store [updated] links to different sources of GIS data. This collection may vary according to my works, but it will mainly contain data about EU, UK and Spain.

UK

British Government’s data https://data.gov.uk/

Ordnance Survey Open Data https://www.ordnancesurvey.co.uk/

British Geological Survey. OpenGeoscience http://www.bgs.ac.uk

Scottish Spatial Data Infrastructure https://www.spatialdata.gov.scot

Scottish Natural Heritage https://gateway.snh.gov.uk/natural-spaces/

Edinburgh Council Open Data http://edinburghopendata.info/

Spain

Spanish Government Open Data http://datos.gob.es/es/catalogo

National Center for Geographic Information http://centrodedescargas.cnig.es/CentroDescargas/index.jsp

Junta de Castilla-La Mancha Open Data http://data-castillalamancha.opendata.arcgis.com/

EU

Eurostat GISCO. Administrative boundaries, infrastructure and land cover http://ec.europa.eu/eurostat/web/gisco

Global

UNESCO Institute for Statistics http://data.uis.unesco.org/

Global administrative areas http://www.gadm.org/

University of Pennsylvania international GIS database http://guides.library.upenn.edu/globalgis

USA

Federal government’s open data site https://www.data.gov/open-gov/